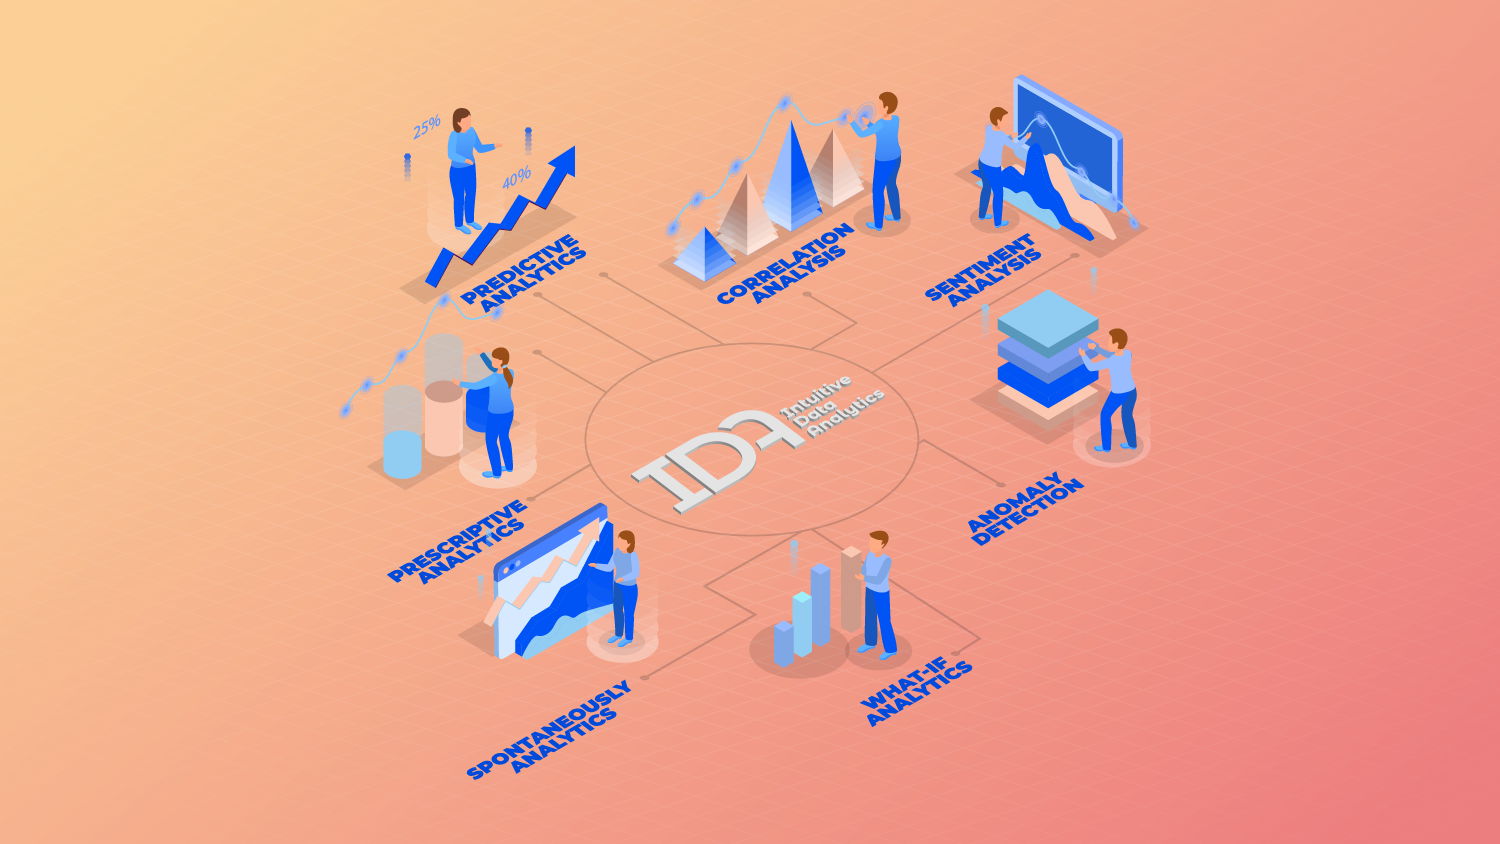
Predictive Analytics
Predictive analytics uses data to forecast future outcomes. By evaluating historical data, employing statistical modeling, and data mining, you can uncover hidden patterns. Apply AI and deep learning to stay ahead of emerging trends that impact your business.
Examples:
- Create accurate sales forecasts as conditions change
- Forecast demand for products or services
- Predict churn for subscription services
Prescriptive Analytics
Prescriptive analytics goes beyond predicting future outcomes. Analyzing underlying variables that impact outcomes on a deeper level, prescriptive analytics can run simulations and provide specific recommendations to improve results.
Examples:
- Optimize operations and supply chains
- Recommend optimal pricing for maximizing profitability
- Prescribe inventory levels to meet fluctuating demand
Correlation Analysis
Correlation analysis understands the complex interdependencies between multiple variables using natural language and a drag-and-drop interface. Easily adjust key variables and see the impact they have on outputs. Correlation analysis measures the strength and direction of the relationships, looking past basic assumptions to study the multiple variables that determine results.
Examples:
- Understand the impact of marketing campaigns on sales
- Isolate root causes and learn how they impact outcomes
- Identify correlations between oil price fluctuations and production costs
Sentiment Analysis
Sentiment analysis uses natural language processing to identify the mood or emotional tone within textual data. This helps you capture qualitative perceptions that may not be obvious in quantitative data.
Examples:
- Analyze customer feedback surveys to identify customer frustrations
- Review customer reviews or call center logs to evaluate customer service response
- Understand customer triggers that drive positive or negative interactions
Anomaly Detection
Anomaly detection identifies outliers and unusual data points or events, searching for patterns that differ from norms. Recognize potential threats, risks, and errors that may be hard to identify through standard analysis.
Examples:
- Analyze sensor data to find manufacturing defects
- Flag changes in financial models to determine risk
- Detect anomalous transactions to identify potential fraud
What-if Analytics
What-if scenarios let you quickly evaluate various scenarios to see how changes in variables can impact outcomes. By modeling what-if scenarios, businesses can test hypotheses without coding using drag-and-drop and intuitive tools.
Examples:
- Model the impact of price changes on profit margins
- Simulate economic conditions to evaluate outcomes
- Compare marketing budget allocations to projected conversions
Spontaneous Analytics
Spontaneous analytics enables you to go on a journey of discovery without having to tie up IT resources or know how to code. Voice, gestures, touch, or click to drill deep into data, display relevant analytics, and ask questions to get the answers you need.
Examples:
- Get insights with natural language
- Encourage self-service data analytics
- Democratize data across organizations
Tap, swipe, or ask your questions. IDA listens and delivers, taking you on journey of discovery. You don’t have to be a data scientist or data analyst to unlock powerful insights to power your business. Interact with your Intuitive, Interactive Business Intelligence
NO CODE DATA ANALYSIS
Intuitive, Interactive Business Intelligence

Find out how IDA can revolutionize the way your team works to achieve success
Trademark © 2021 IDA | www.intuitivedataanalytics.com
Patented Technology. All rights reserved.
Privacy Policy | ADA Compliance


